WINGS is the UMN Rocket Team's proprietary software that's used to display data during and after rocket launches. I joined
the team at the start of my junior year (September 2024), and have since helped contribute to building the software's robust
memory and type safe back-end using Rust and the front-end using TypeScript. I was chosen to lead the group of developers that
comprise the club's software sub-team, and have assumed the position my senior year.
The software supports both live telemetry reception through a USB port and also playback of data from
previous launches through different file formats. The front-end can display processed data for visualization with its graph, indicator
light, 3D model, and readout displays. The project was selected by the rocket team to be the focus of the team's podium presentation
at the
2025 IREC competition
because of the software's unique capability to be able to work with a variety of flight computers from different brands, which typically
requires the usage of multiple ground stations, making WINGs one of the few systems out there that provide a universal ground station.
One of the first decisions I made as software lead was to open source the software, in order to open the door for collaboration
among the broader rocketry community. Since August 2025, I have been one of the primary maintainers of the
public repository for WINGS.
Table of Contents
Technologies Used
Front End
- TypeScript
- SolidJS as a reactive JS library
- Tailwind CSS for styling
- Tauri software framework
Back End
- Rust
- Tauri software framework
Personal Contributions
Indicator Lights
My first major contribution was creating the boolean indicator light display for the front-end. This included creating both the settings modal and the display itself. The boolean indicator lights help users monitor variables by using display lights to indicate whether the incoming data satisfies the specified inequalities or not. The lights turn green when the conditions are met, or turn red otherwise.
 Indicator lights changing colors based on incoming data
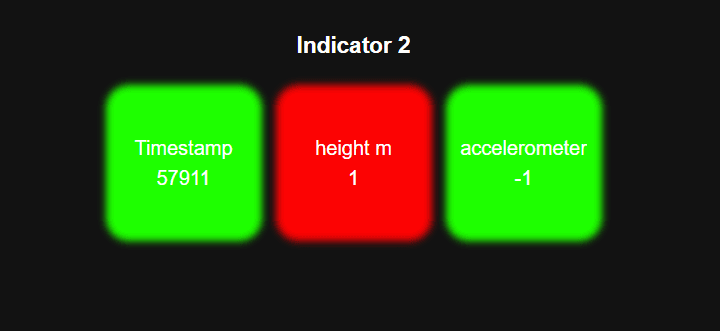
Altus Metrum Checksum
In my first back-end project, I added checksum calculations to detect accidental changes/errors in incoming telemetry data in our Altus Metrum/AltOS file handler. The rocket team uses Altus Metrum products like the TeleMetrum altimeter with GPS and RF telemetry link and the TeleDongle which is used on the ground station to interact with the rockets. By adding checksum calculations for AltOS packets, I was able to filter out bad packets sent using these products and remarkably enhance the display of rocket data. This WINGS feature works for both live data sent from the TeleMetrum and data saved to a file.
 Graph displaying data after checksum calculations
Zoom-Capable Graphs
I integrated the ability to zoom in or out on graphs, a long-awaited yet useful feature for data visualization. Users have the ability to zoom in on data, and drag the x-axis horizontally in order to get a closer look at older or newer data. Additionally, I created a new display element which has a fixed x-axis and works by displaying new data on the right while pushing out old data to the left, creating a sliding window or oscilloscope-style effect. This new display is useful for realtime display of time-series data.

InfluxDB and Grafana Integration
One of the major limitations of WINGS was the lack of readily available, out-of-the-box data visualization components. To address this, I designed a new telemetry architecture centered around integrating InfluxDB, a time-series database optimized for high-throughput numerical data, and Grafana, a flexible dashboarding platform for real-time visualization. My goal was to extend WINGS in a way that preserved its existing data processing pipeline while enabling live dashboards, advanced querying, and long-term extensibility.
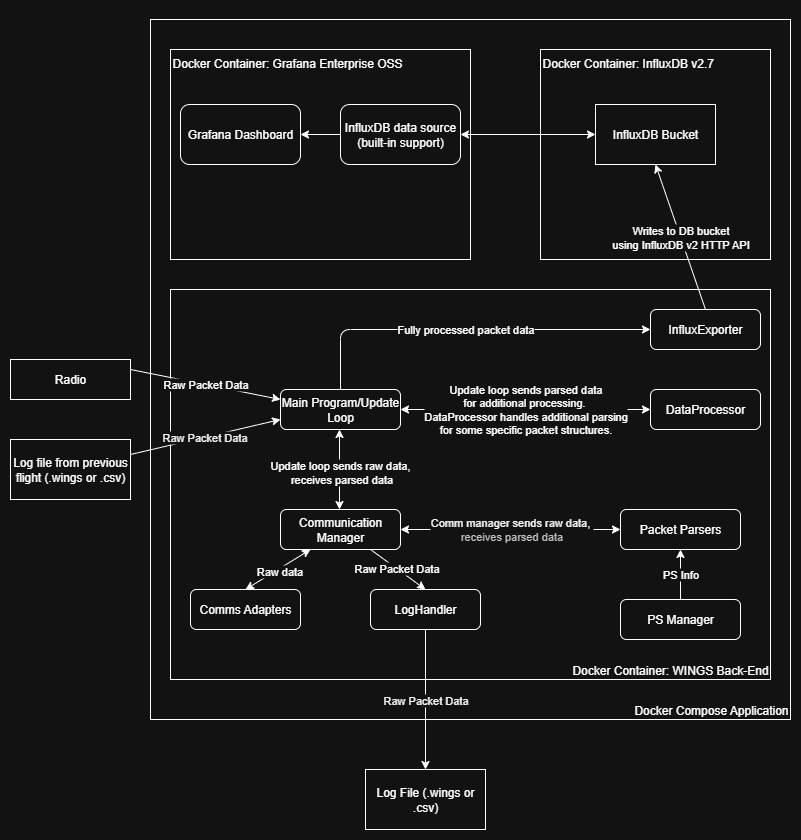
I designed and implemented an exporter module that converts processed telemetry into structured time-series points and streams them into InfluxDB with minimal overhead, sustaining high update rates with sub-second latency. I provisioned Grafana dashboards directly against this data source, enabling live plots, derived metrics, and time-based analysis without duplicating visualization logic in the frontend.
Other Contributions
Other contributions I've made to the project include improving the functionality and styling of all of the settings modals for the
displays, adding help text/documentation throughout to improve software ease-of-use, conducting end-to-end testing to ensure implemented
features work, and other various small front-end improvements. One of the most rewarding aspects of working on this project has been
being able to develop software within a collaborative, team environment.
Since assuming my role as Software Lead in July 2025, I've also contributed to recruiting and onboarding new developers, guiding
design decisions for the ground station software, and reviewing code to ensure consistency, maintainability, and correctness across the codebase.
I introduced clearer development workflows around version control, documentation, and code review, which significantly improved team velocity and
reduced integration friction.